

Many traders tend to assess their trading strategies in the CFD markets primarily by looking at the profit or loss in their portfolio over a specific period. If there was a profit in the last year, they view their strategy favorably, whereas a loss often leads to a negative assessment.
However, evaluating a trading strategy solely based on profit or loss can be misleading. To accurately measure performance, it’s crucial to consider a variety of factors that reveal how the strategy performs under different market conditions. A comprehensive evaluation includes a set of indicators that provide a holistic view of the trading strategy’s effectiveness, beyond just profit and loss.
To properly evaluate a trading strategy, traders should regularly assess twelve key indicators—ideally, on an annual basis. These indicators form a reliable scorecard that offers a clear snapshot of the portfolio’s performance throughout the year.
Let’s explore these indicators one by one:
- Win Ratio:
- Definition: The percentage of winning trades out of the total trades executed.
- Formula:
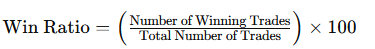
- Example: If you made 50 trades and 21 were profitable, the win ratio would be 42%.
- Payoff Ratio:
- Definition: The average profit per trade compared to the average loss per trade.
- Formula:
- Example: If your average gain is $333.33 and your average loss is $187.50, the payoff ratio would be 1.778.
- Commission Ratio:
- Definition: The percentage of total gross profit used to cover commissions.
- Formula:
- Example: If you paid $2,000 in commissions on a $10,000 profit, the commission ratio would be 20%.
- Largest Winning Trade:
- Definition: The trade with the highest positive return.
- Formula: Largest Winning Trade=(Exit Price−Entry Price)×Number of Contracts×Contract Size
- Largest Losing Trade:
- Definition: The trade with the highest loss.
- Formula: Loss per CFD=Entry Price−Stop-Loss Level
- Total Potential Loss: Total Loss=Loss per CFD×Position Size
- Average Winning Trade:
- Definition: The average profit across all winning trades.
- Example: If your total profit from three winning trades is $450, the average winning trade would be $150.
- Average Losing Trade:
- Definition: The average loss across all losing trades.
- Example: If your total loss from 20 trades is $5,000, the average losing trade would be $250.
- Largest Number of Consecutive Losses:
- Definition: The maximum number of consecutive losing trades.
- Impact: This indicator helps assess risk and manage emotional responses during prolonged losing streaks.
- Average Number of Consecutive Losses:
- Definition: The average number of losing trades in a row over a period.
- Purpose: It offers insight into the potential downside and volatility of a trading strategy.
- Largest Trading Account % Drawdown:
- Definition: The maximum percentage decline in the account value from its peak to its lowest point.
- Example: If your account drops from $100,000 to $80,000, the drawdown would be 20%.
- Average Trading Account % Drawdown:
- Definition: The average percentage decline in account value over a period.
- Purpose: It helps gauge the overall risk and stability of the trading strategy.
- Annualized Profit/Loss on Trading Account:
- Definition: The annualized measure of overall profitability or loss.
- Purpose: It standardizes the performance, making it easier to compare across different periods.
Conclusion
These twelve indicators provide traders with a comprehensive framework for evaluating their trading strategies. By regularly assessing these metrics, traders can gain a reliable, broad view of their portfolio’s performance and make informed decisions based on a rational and holistic approach.